
48
The experimental plot consisted of one plant from which
one plagiotropic branch was extracted every 28 days,
IURP ÁRZHUinJ XnWiO IUXiW UiSHninJ. 7KiV ZDV dRnH in RUdHU
to determine the levels of dry matter as well as the
concentrations and accumulations of N, P, K, Ca, Mg and
S in the fruits.
On average , each of the branches were seen to contain a
total of thirteen rosettes with coffee fruits.
Sampling began in mid August 14, 20 days after anthesis
for the early and intermediate genotypes
(12V and 10V)
,
and in mid September for the late and very-late genotypes
9 and ,Siranga
.
6i[W\-ÀYH XniIRUP SODJiRWURSiF EUDnFKHV SHU JHnRW\SH ZHUH
SUHYiRXVO\Dnd UDndRPO\PDUNHd ZiWKÀYHEUDnFKHV UDndRPO\
removed and sampled at every 28 days. The sampling
ÀniVKHd Rn MDUFK 6 $SUiO MD\ 7 Dnd -XO\ 3 IRU WKH HDUO\
intermediate, late and very late genotypes, respectively.
The fruits were extracted and dried in a greenhouse with
forced air circulation at 70°C until constant mass was
obtained. Their dry matter was then determined on a 0.001
g precision scale.
The accumulation of nutrients in the fruits present on
the branches was calculated considering the dry matter
and the concentration of the respective nutrients. The
percentage of accumulation at different seasons was then
calculated, and the last collection was considered 100%,
in which more than 80% of the fruits on the branches
were fully ripe.
The data were subjected to regression analysis, and the
mathematical models were chosen in accordance with
WKH HTXDWiRnV ZiWK WKH EHVW ÀW FRUURERUDWHd E\ WKH KiJKHU
YDOXHV IRU WKH FRHIÀFiHnWV RI dHWHUPinDWiRn
(R2)
and by
WKH ViJniÀFDnFH RI WKH UHJUHVViRn FRHIÀFiHnWV Dnd WKH
regression F test
.
Results and discussion
The four genotypes
(clones)
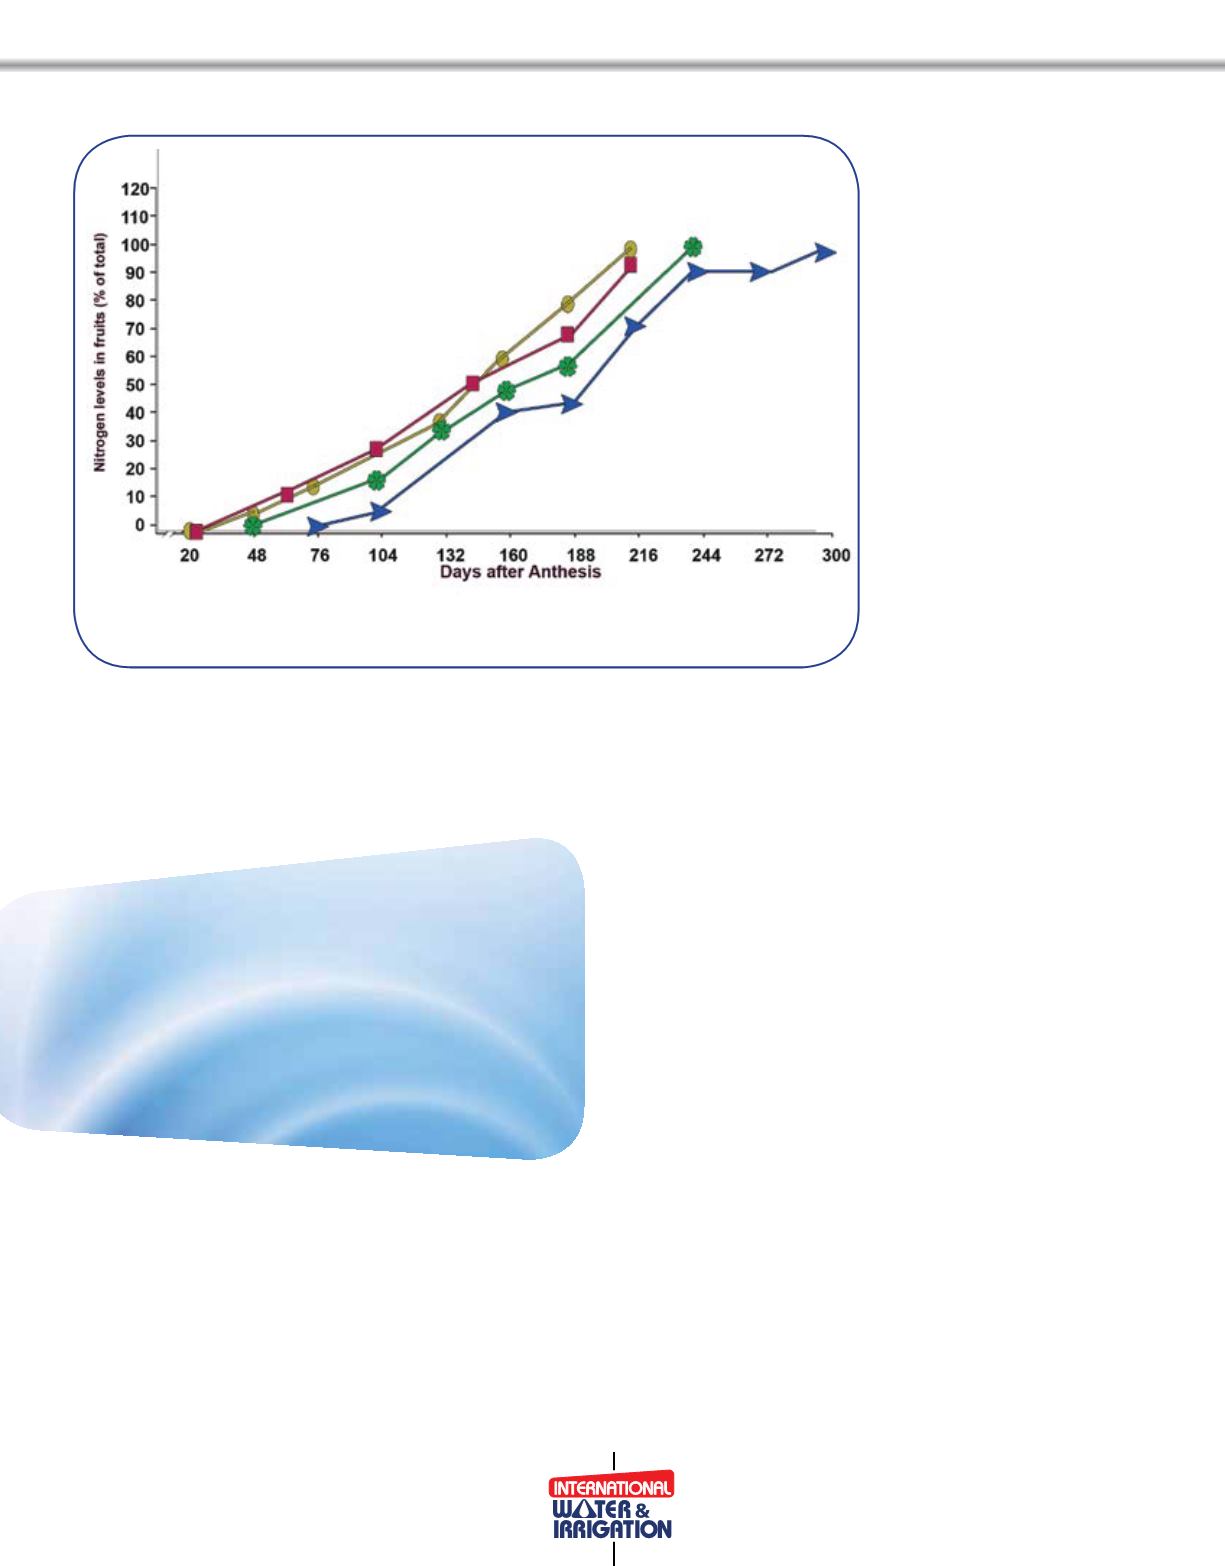
of ‘Conilon’ coffee showed
similar dry matter accumulation curves in fruits
(See
Figure One)
.
In all cases, the period of fruit formation presented
sigmoidal behavior - an initial stage with less expressive
accumulation rates, followed by a stage of rapid expansion
Dnd WKH KiJKHVW UDWHV Dnd D ÀnDO VWDJH ZiWK OHVV H[SUHVViYH
rates at the end of the cycle of fruit formation.
This behavior bears strong similarities to what has been
previously observed in Arabica coffee plants whose trend
curves showed sigmoidal
6 shaSed
characteristics,
Fertilization management of different
C. Canephora Conilon plants coffee
genotypes should differ in accordance
with the length of the cycle so as
to supply plants at times of higher
nutrient need
Figure One:
'ry Patter aFFuPuOatiRn in Iruits as a SerFentage RI the FuPuOatiYe
tRtaO RI IRur genRtySes FORnes RI &RniORn FRIIee IrRP anthesis tR Iruit Paturity


