
20
system in Scenario Three is used to irrigate Scenario One.
What has to be taken into account, however, is that for a
few hours, additional energy was required, making up just
16% of the annual energy requirements. Consequently, the
total energy that needs to be purchased from the energy
supplier in Scenario Three amounted to 2,215 MWh, 74%
of the total energy demand.
The 2.1 MW PV system laid out in Scenario Four was seen
to produce 83% of the annual energy demanded by S2.
The energy purchased in this scenario was 1,272 MWh,
equivalent to 42.6% of the total annual energy demand.
Economic viability
In the BMI region, operating costs result in general from
the electricity consumption in the pumping station, with the
impacts of the implementation of energy saving measures
Zere TXDntified
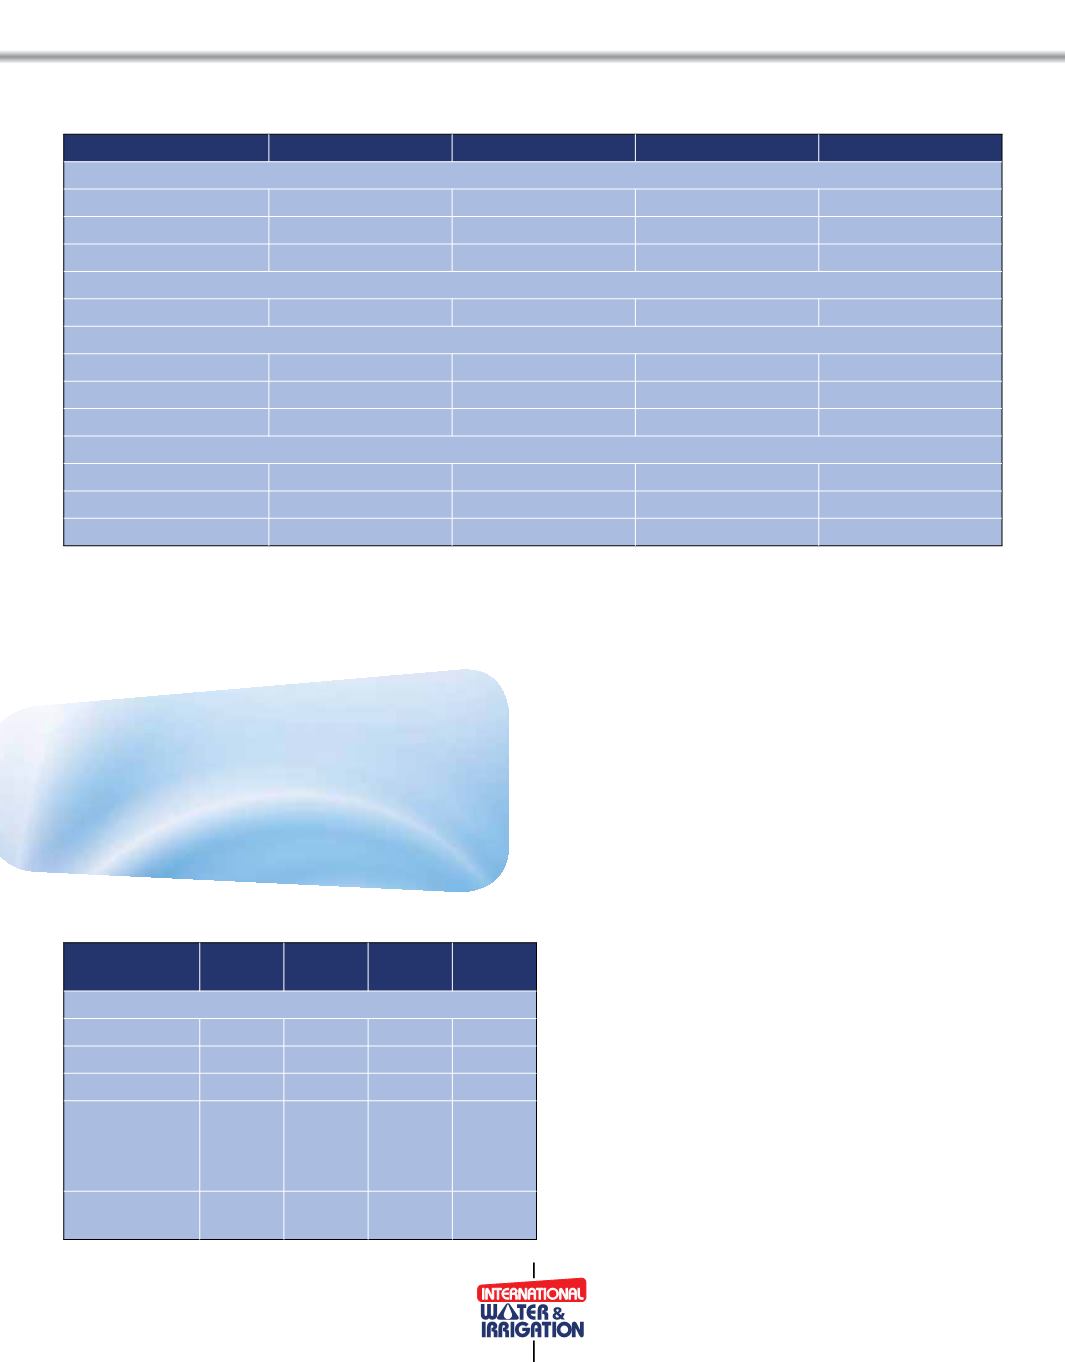
The energy costs for the four Scenarios are shown in
Table Three
.
Conclusions
In Spain, the irrigated areas with pressurized irrigation
networks are usually organized on-demand and, for that
reason, require a great deal of energy for their operation,
so much so that energy consumption in irrigation
(water
pumping)
accounts for between 50%-70% of the total
greenhouse gas
(GHG emissions)
of the agricultural sector.
As energy consumption in the pumping stations and GHG
emissions are directly linked, water supply generates
significDnt *+* ePissions PeDning Dny PeDsXre to
reduce energy demand is liable to make a considerable
contribution to the reduction of the greenhouse effect,
while from the farmer’s perspective, the continued
increases in electricity tariffs encourage the necessity of
adopting energy saving measures that would reduce the
total energy costs.
■
Any measure to reduce energy
demand is liable to make a
onsiderable contribution to
profitability
Table Two: Annual Energy Balance
Scenario One
Scenario Two
Scenario Three
Scenario Four
Energy Demand (MWh annually)
Sector One
4,319
2,067
2,067
2,067
Sector Two
-
918
918
918
Total
-
2,985
2,985
2,985
Photovoltalic array production (MWh annually)
Total
-
-
1648
3543
Purchased Energy in quantities (MWh annually)
Sector One
4,319
2,985
2,067
354
Sector Two
-
148
918
Total
2,215
1,272
Purchased Energy in terms of percentages (MWh annually)
Sector One
100%
100%
16%
100%
Sector Two
-
100%
17%
Total
74%
42.6%
Table Three: Energy cost analysis
Scenario
One
Scenario
Two
Scenario
Three
Scenario
Four
Energy Cost (€)
Sector One
-
82,617 17,731 91,797
Sector Two
-
248,051 206,709 42,641
Total
475,085 330,668 224,440 134,258
Energy costs
according to
area
(€ per Hectare)
11.8.8 82.7
56.1
33.6
Energy Cost
Savings (%)
0
30.4
52.8
33.6


