
24
sown ten cms apart in double rows with the rows were 30
cms apart.
Almost immediately after their emergence, the plants were
thinned to a spacing of 30 cm.
The cotton harvest got under way at the end of September
and was completed by the third week of November, making
for an average harvest duration of 53 days.
In each of the three years, the cotton was hand picked at
four to seven day intervals, with the total weight per plot
was checked at each harvest time.
Fertilizer management
A basic dose of of a compound fertilizer
(16% N, 35% P2
O5 and 8% K2 O)
was applied at the rate of 450 kilograms
per hectare at the time of plowing before seeding, with the
fertilizer dose supplemented with urea
(46% N)
, applied
through the irrigation system.
Soil sampling and chemistry analyses
In a saline soil, the soil salinity distributions clearly showed
leaching near the drip lines, an area where the root density
has been found to be at its maximum level.
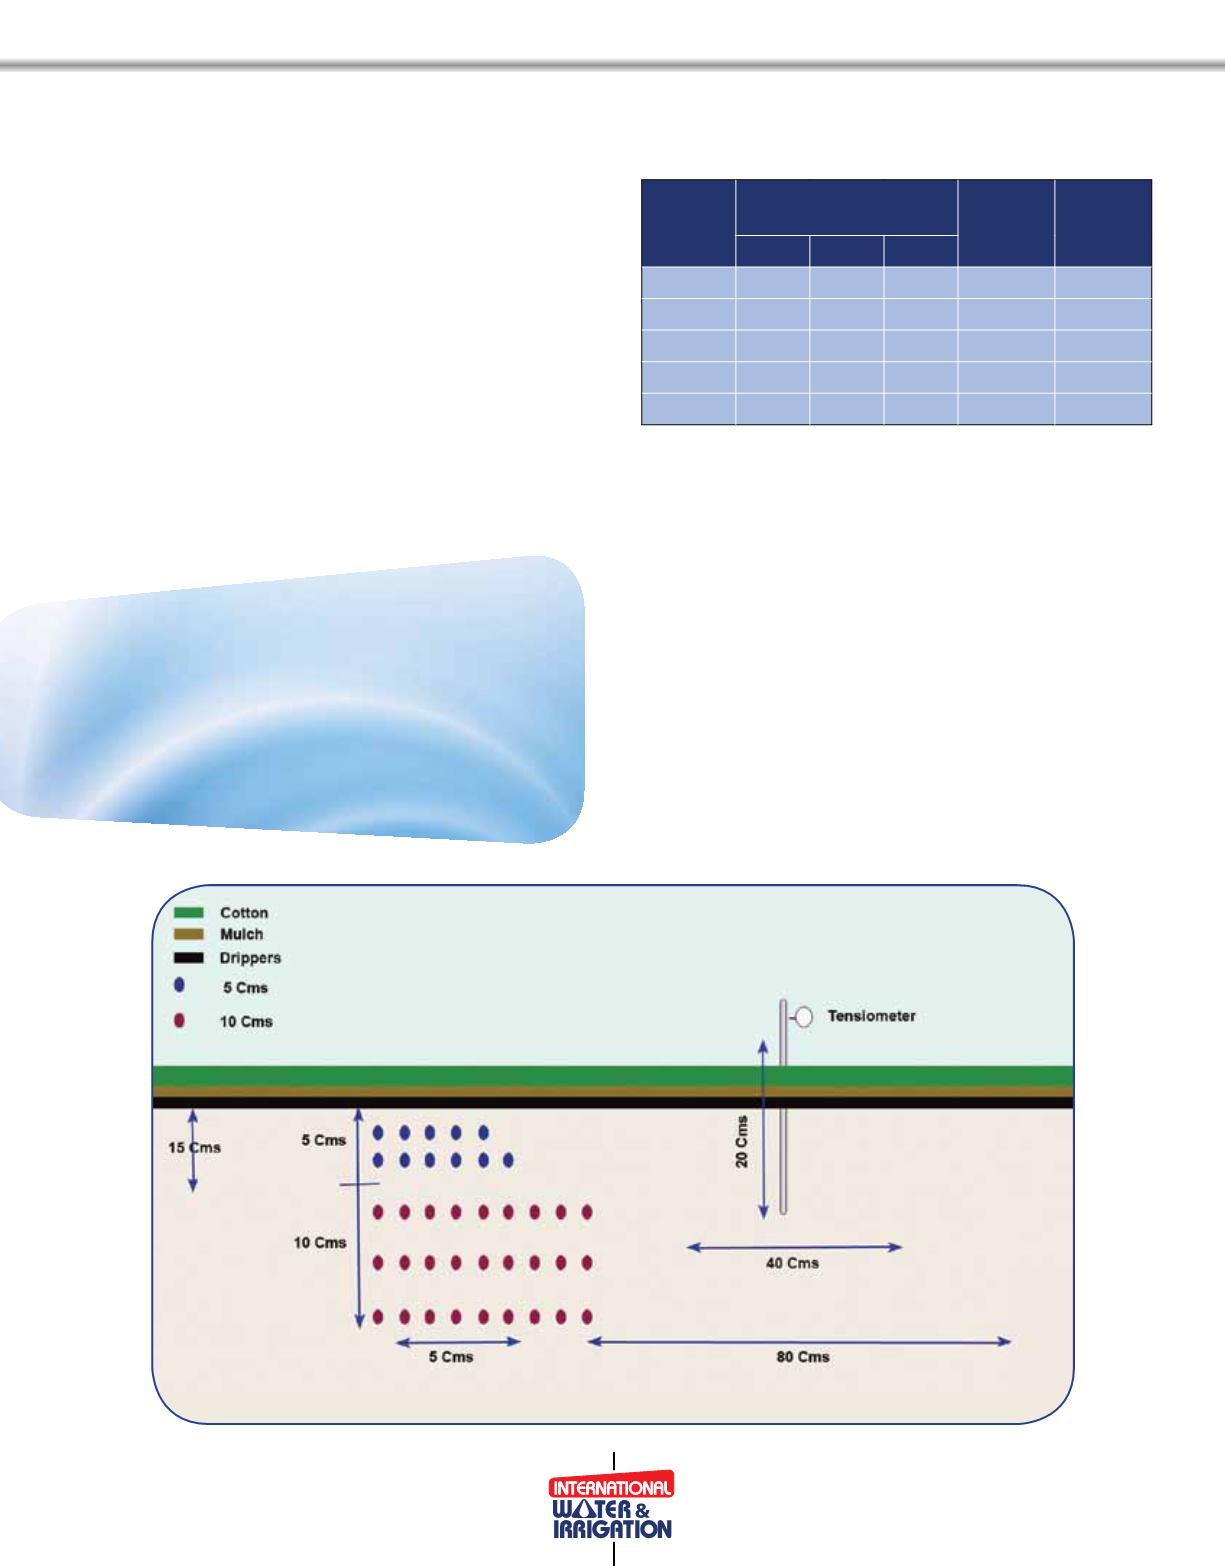
Since the low ECe zones were found to be within 40 cms of
the dripper, a soil depth interval of 0-40 cm was analyzed.
Soil samples were obtained on soil cores from each plot
before seeding as well as the end of the irrigation season.
Results and discussion
Weather and irrigation
The summer temperatures for year one of the test were
higher than those in the two following years, although during
the other months, the mean temperatures were very similar
among the three years
(See Figure Two)
.
Table One: Soil texture and bulk density of the initial
soil profile at ;inMiang Northwest China
Soil
depth
(cms)
Soil mechanical
composition (%)
Soil
texture
Soil
bulk
density
Clay Silt
Sand
0-40
1.18 93.5 5.34 Silt
1.33
41-60 1.03 99.0 0.00 Silt
1.43
61-90 0.54 95.4 4.07 Silt
1.47
91-120 0.41 96.0 3.56 Silt
1.56
121-180 0.26 96.1 3.68 Silt
1.38
During the course of the trial,
the levels of soil salinity, sodicity
and nutrients were signi
fi
cantly
affected by the soil matric potential
thresholds under drip irrigation
Figure One:
Dimensions of beds and position of the tensiometer and soil sampling


